-
Whatsapp: +86 15516933785
-
Email: hanlin@hanlinplayground.com
-
Address: Shangjie District, Zhengzhou City, Henan Province, China
-
Whatsapp: +86 15516933785
-
Email: hanlin@hanlinplayground.com
-
Address: Shangjie District, Zhengzhou City, Henan Province, China

Indoor Playground Profit Margin: Is It a Profitable Business Investment?
Is an indoor playground a profitable business investment for new entrepreneurs?
Yes, the indoor playground industry is highly profitable, with average net profit margins ranging from 20% to 40%. Successful operators typically achieve a full return on investment within 18 to 24 months by balancing weekday open play revenue with high-margin weekend birthday parties and events.
Key Financial Benchmarks for Indoor Playgrounds
What are the standard profit margins and financial targets for an indoor playground business?
Industry analysis indicates that a healthy indoor playground typically generates a net profit margin between 20% and 40%. Investors generally expect a full return on investment (ROI) within 18 to 24 months, provided the business maintains an EBITDA margin above 30%.

Typical Net Profit Percentage Ranges
Net profit margin measures how much actual cash remains after paying all expenses. For indoor playgrounds, this number is often higher than in retail or food service industries. This is primarily because inventory costs are significantly lower; once the equipment is installed, it does not require daily restocking like a grocery store or restaurant.
But let’s be realistic—margins fluctuate based on business maturity. A new facility might see lower percentages in the first year due to aggressive marketing spend to build a customer base. Conversely, an established venue with paid-off equipment often reaches the higher end of the spectrum.
| Performance Level | Net Profit Margin Range |
|---|---|
| Average Performance | 15% – 20% |
| Healthy Performance | 20% – 30% |
| Top Tier Performance | 35% – 40%+ |
If your margin drops below 15%, take a hard look at your overhead costs rather than blaming a lack of customers. Monitoring this percentage monthly is not optional—it is vital for financial health.
Note: These figures represent industry averages. Actual margins depend heavily on local market conditions, competition levels, and operational efficiency.
Average Return on Investment Timeline
The Return on Investment (ROI) timeline is the period it takes to earn back your initial startup capital. In the indoor playground industry, the standard timeline is 18 to 24 months.
Compared to other real estate-heavy businesses, that is lightning fast. The “payback period” is shorter because the primary asset—the playground structure—generates revenue immediately without requiring constant repurchasing of goods.
Think of the playground equipment like a high-end arcade game in a Family Entertainment Center (FEC). The initial cost to buy the machine is high. However, every coin dropped in is mostly profit because the machine does not need new materials to run every day. Similarly, your soft play structure attracts ticket sales repeatedly with minimal daily input costs.
If your projections show an ROI timeline longer than 36 months, you need to re-evaluate your business model immediately. This delay usually suggests that the initial investment was too high relative to the local population size.
EBITDA Expectations for Healthy Businesses
EBITDA stands for Earnings Before Interest, Taxes, Depreciation, and Amortization. While net profit includes everything, EBITDA focuses strictly on operational performance. It removes the effects of loan payments and accounting decisions.
For a healthy indoor playground, you should target an EBITDA margin of 30% or higher.
This metric is crucial if you plan to sell the business later. Buyers look at EBITDA to see if the playground makes money from its core operations. A low EBITDA means the daily cost of running the facility is eating up too much revenue.
Why EBITDA matters more than Net Income for valuation:
- Depreciation: Indoor playgrounds have large assets (play structures) that depreciate on paper. This lowers “Net Income” for tax purposes, making the business look less profitable than it actually is in terms of cash flow.
- Cash Flow View: EBITDA gives a clearer picture of the actual cash generated by customers walking through the door.
When analyzing financial feasibility, prioritize EBITDA to understand the true operational strength of the facility.
Analyzing Revenue Sources for Maximum Profit
Which revenue stream contributes most significantly to an indoor playground’s bottom line?
Birthday parties and private events are the primary drivers of high profit margins, often contributing 30% to 50% of total revenue. While general admission covers basic overhead, packaged events and ancillary sales like food and beverage generate the surplus income required for substantial profitability.
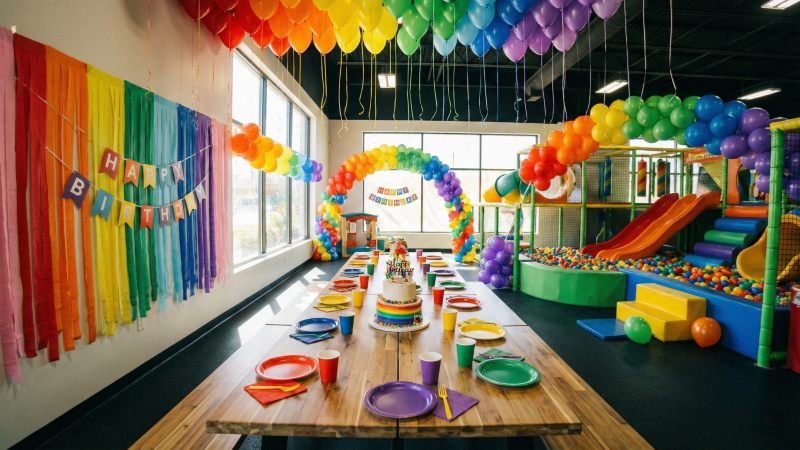
Why Party Rooms Are the Main Profit Engine
In the indoor playground industry, the “Party Room” is the most valuable square footage you possess. While open play tickets provide steady cash flow, birthday parties provide lump-sum revenue with higher margins.
Parties are highly profitable because they are predictable. Unlike walk-in traffic, which fluctuates with the weather, a party is booked weeks in advance. This allows you to schedule staff precisely, eliminating wasted labor hours.
Consider the difference between a “Walk-in Customer” and a “Party Booking” like the difference between a casual arcade player and a VIP lane reservation at a bowling center. The casual player might spend a few dollars and leave. The VIP reservation guarantees a set amount of revenue for a specific time block, maximizing the yield of that space.
Revenue Comparison: Walk-in vs. Party Package
| Feature | Walk-in Ticket | Birthday Party Package |
|---|---|---|
| Average Ticket Price | $15 – $20 per child | $300 – $500 per event |
| Payment Timing | At the door | 50% deposit upfront |
| Add-on Potential | Low (snacks/drinks) | High (extra kids, pizza, themes) |
| Marketing Cost | High (constant ads needed) | Low (guests become future leads) |
Here is the multiplier effect: A birthday child brings 15 friends. If those friends have fun, they ask their parents to host their parties there too. This creates a cycle of recurring revenue without additional advertising spend.
The Impact of Café and Food Sales on Margins
A well-run café is not just an amenity; it is a strategy to extend “dwell time.” Dwell time is the length of time a family stays in your facility. The longer they stay, the more money they spend.
If a playground does not serve food, hungry families must leave after 1 or 2 hours. If you offer high-quality snacks and coffee, that same family might stay for 3 or 4 hours. This keeps the facility looking busy and increases the likelihood of impulse purchases.
Realistically, Food and Beverage (F&B) sales should account for roughly 15% to 20% of your gross revenue. While the gross margin on food is high (often 60-70%), the net margin is tighter due to waste and preparation labor.
Note: Health department regulations and permit requirements for serving food vary significantly by state and county. Always verify specific kitchen requirements with your local health inspector before construction planning.
To maximize profit, skip the full kitchen. Instead, use a “Heat and Serve” model. Buy pre-made items like muffins or pizzas that only require warming. This reduces the need for skilled kitchen staff, similar to how a movie theater concession stand operates efficiently with minimal training.
Ticket Sales and Membership Recurring Revenue
General admission (Open Play) is the foundation of your revenue. It pays the rent and electricity. But here is the trap: relying solely on single-ticket sales is risky because it is inconsistent.
To stabilize income, successful operators push Memberships. A monthly membership converts a customer from a one-time visitor into a recurring revenue source. Even if the member does not visit in a specific month, the automatic payment processes.
This concept is similar to a gym membership model but applied to family entertainment. The goal is to build a base of subscribers that covers your fixed costs.
Benefits of a Membership Model:
- Predictable Cash Flow: You know exactly how much money will enter your account on the 1st of the month.
- Increased Ancillary Spend: Members don’t pay for entry, so they feel “richer” inside the facility. They are statistically more likely to buy snacks, coffee, or merchandise during their visit.
- Customer Loyalty: Members will choose your facility over a competitor’s park because they have already paid for access.
Prioritize selling memberships over single tickets whenever possible. While the per-visit revenue might look lower on paper, the lifetime value of a member is significantly higher than a walk-in customer.
Operating Costs and Budgeting Red Flags
What are the primary expense categories that can jeopardize the financial stability of an indoor playground business?
Rent and labor are the most significant operating costs, typically consuming between 40% and 50% of total gross revenue combined. To ensure long-term profitability, operators must strictly limit rent expenses to 20% of revenue and cap payroll costs at 25%.
Keeping Rent Under Critical Revenue Thresholds
Rent is usually your largest fixed expense. In the indoor playground industry, the “20% Rule” is a standard safety measure. This means your annual rent (including additional fees) should never exceed 20% of your projected annual gross revenue.
Cross that line to 30% or more, and it becomes nearly impossible to make a profit. You still need money for staff, insurance, and utilities, and the math simply won’t work.
Lease Structure Warning: NNN vs. Gross Lease
When negotiating with landlords, pay close attention to the lease type.
- Gross Lease: You pay a flat fee. The landlord pays for building taxes and maintenance.
- Triple Net Lease (NNN): You pay a lower base rent, plus property taxes, insurance, and building maintenance (CAM charges).
Don’t get caught by the sticker price. Many first-time operators look only at the base rent per square foot. However, CAM charges can add $3 to $5 per square foot to your costs. Always calculate the total monthly occupancy cost before signing.
Labor Cost Management and Staffing Efficiency
Labor is a variable cost, meaning you can control it. The industry benchmark for payroll is between 20% and 25% of gross revenue.
Where do new owners burn cash? Overstaffing during slow periods. An indoor playground has very distinct peak times. Weekends and school holidays are busy; Tuesday mornings are usually quiet.
To manage this, successful operators use a flexible staffing model similar to a Family Entertainment Center (FEC) arcade. During a busy Saturday, you need staff at the front desk, the café, the toddler zone, and the main structure. During a slow Wednesday, one cross-trained employee might handle the front desk and the café simultaneously.
Staffing Allocation Example
| Time Period | Staff Needed | Focus Area |
|---|---|---|
| Weekday Morning | 1 – 2 Staff | Check-in & Light Cleaning |
| Weekday Afternoon | 2 – 3 Staff | After-school rush & Café |
| Weekend Peak | 6 – 8 Staff | Party Hosts, Safety Monitors, Café, Check-in |
So, how do you handle the midweek slump without burning cash? Use a digital scheduling tool to track labor hours in real-time. If the facility is empty at 6:00 PM, send non-essential staff home early to protect your margins.
Insurance and Ongoing Maintenance Expenses
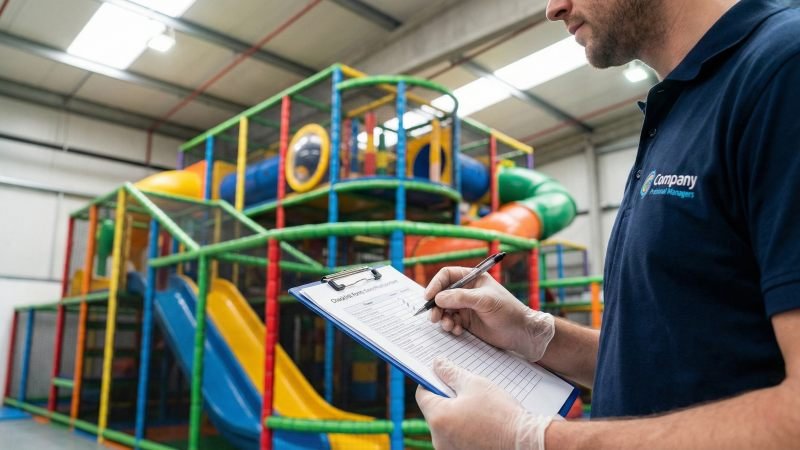
Safety is the product you sell to parents. Therefore, insurance and maintenance are non-negotiable costs.
General Liability Insurance
You cannot operate without General Liability Insurance. This protects you if a child gets injured. Expect to pay roughly 3% to 5% of your gross revenue on premiums.
Note: Insurance premiums depend heavily on your safety record, location, and the specific equipment you own (e.g., slides vs. trampolines). Trampolines often trigger higher rates.
Maintenance and Cleaning
Maintenance is not just about fixing broken things; it is about prevention.
- Daily Cleaning: Staff must wipe down surfaces every night.
- Professional Deep Cleaning: This usually happens quarterly or monthly (ball pit washing).
- Safety Inspections: Bolts and netting must be checked regularly.
Think of your play structure like a commercial elevator. It carries thousands of people daily, and safety is paramount. Regular inspections prevent catastrophic failures. Budget approximately 1% to 2% of revenue for repairs and Maintenance and Cleaning (like worn-out foam pads or netting) to keep the facility looking new and safe.
Profit Projection Examples by Facility Size
How does the physical size of an indoor playground impact its financial projections and earning potential?
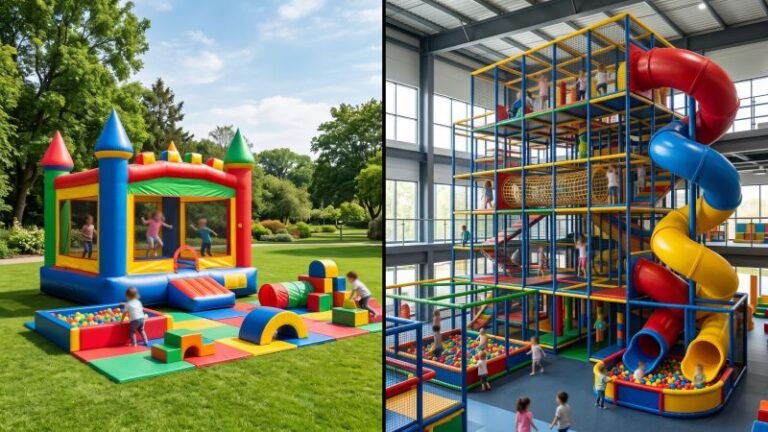
Facility size is the primary determinant of revenue ceilings; small play zones (under 3,000 sq. ft.) typically focus on high profit margins with low overhead, whereas large Family Entertainment Centers (over 10,000 sq. ft.) prioritize high revenue volume through diverse attractions to offset significant operational costs.
Financial Outlook for Small Play Zones
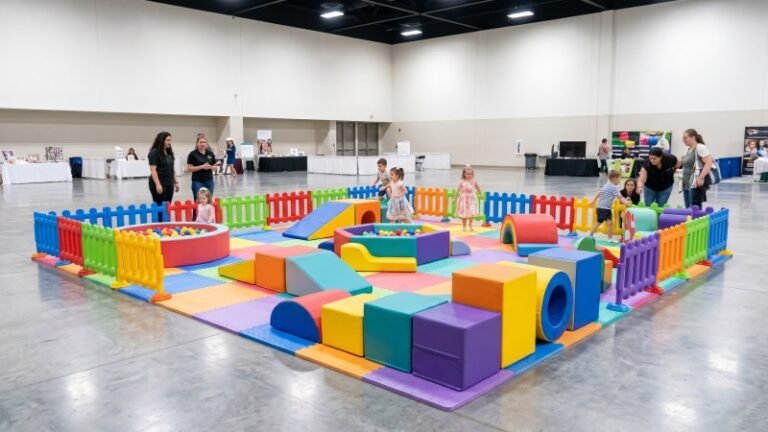
Small play zones usually occupy between 1,500 and 3,500 square feet. These facilities often function like a “boutique” community center that focuses on toddlers and younger children. The business model relies heavily on repeat local customers rather than tourists.
Because the space is limited, the startup cost is manageable. You do not need massive industrial HVAC systems or dozens of employees. Often, the owner acts as the manager, which drastically reduces payroll expenses.
Projected Financials for a Small Zone (Estimated)
| Metric | Estimated Annual Range |
|---|---|
| Total Revenue | $250,000 – $450,000 |
| Operating Expenses | $150,000 – $280,000 |
| Net Profit (Pre-Tax) | $80,000 – $150,000 |
| Break-even Point | 12 – 18 Months |
Note: Construction costs and revenue potential vary based on your city’s real estate prices and population density.
But keep in mind, small zones face a “Revenue Ceiling.” There is a physical limit to how many kids can fit inside safely. Once you reach capacity on a Saturday, you cannot sell more tickets. Therefore, the financial strategy here focuses on efficiency. You must maximize the revenue per customer (café sales) rather than just trying to get more people through the door.
Financial Outlook for Large Family Entertainment Centers
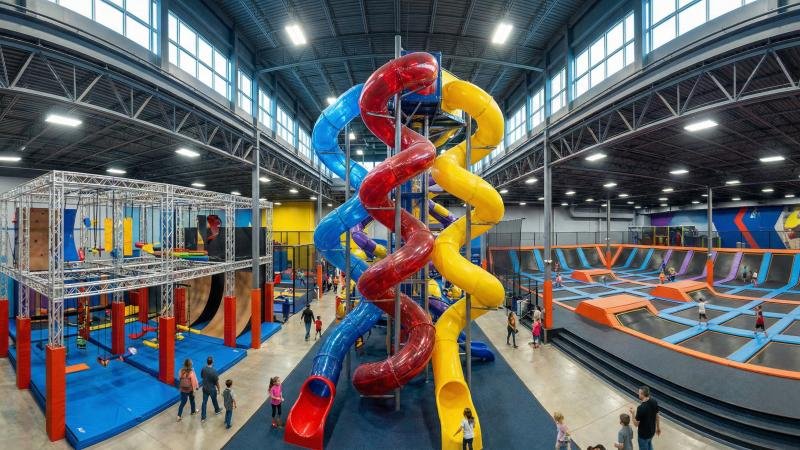
A Family Entertainment Center (FEC) operates on a different scale entirely. These facilities range from 10,000 to 30,000 square feet or more. They are not just playgrounds; they are indoor amusement parks. They often include trampolines, ninja courses, arcades, and laser tag.
The financial outlook for an FEC is volume-based. You need high foot traffic to cover the massive rent. But unlike a small zone, the profit potential is uncapped.
Why FECs Scale Differently:
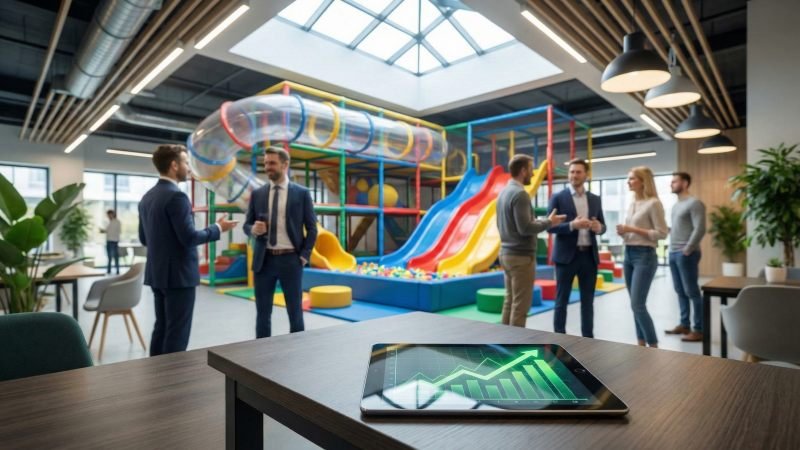
- Diversified Income: You are not relying on just toddlers. You attract teenagers (trampolines), adults (corporate events), and families.
- Higher Ticket Prices: Because you offer more attractions, you can charge a premium entry fee.
- Barrier to Entry: It is hard for competitors to copy you because the startup cost is high (often $1 Million+).
Comparative Revenue Potential
| Facility Type | Primary Customer | Average Stay | Revenue Cap |
|---|---|---|---|
| Small Play Zone | Toddlers (0-6 yrs) | 1.5 – 2 Hours | Limited by fire code capacity |
| Large FEC | All Ages (0-Adult) | 3 – 4 Hours | Very High (High volume + high spend) |
While the percentage of profit margin might be slightly lower in an FEC due to high staffing and insurance, the total dollar amount of profit is significantly higher. For example, earning 20% on $2 Million (FEC) is much better than earning 40% on $300,000 (Small Zone).
Make no mistake: an FEC requires a complex management structure. You cannot run it alone. You need a dedicated general manager, a kitchen manager, and a technical maintenance team to keep the complex machinery running.
Strategies to Optimize Margins After Launch
How can business owners actively increase profit margins once the indoor playground is operational?
Successful operators optimize margins by implementing dynamic pricing to fill the facility during slow weekdays and by aggressively upselling high-margin retail items like branded grip socks, creating additional revenue streams beyond standard admission tickets.
Increasing Revenue During Off-Peak Hours
The biggest enemy of profitability in this industry is “empty air.” You pay rent 24 hours a day, but most customers only come on weekends. Therefore, the hours between Monday and Friday, 10:00 AM to 3:00 PM, represent a massive opportunity.
View your facility like an airline. Once a plane takes off, an empty seat is lost revenue that you can never get back. It is better to sell that seat at a discount than to let it fly empty. Similarly, it is better to have 20 kids paying a discounted rate on a Tuesday morning than zero kids paying full price.
So, how do you fill the gap? Target demographics that are available during the day. This usually means toddlers who are not in school yet or homeschooling groups.
Targeted Off-Peak Programs
| Target Audience | Strategy | Why It Works |
|---|---|---|
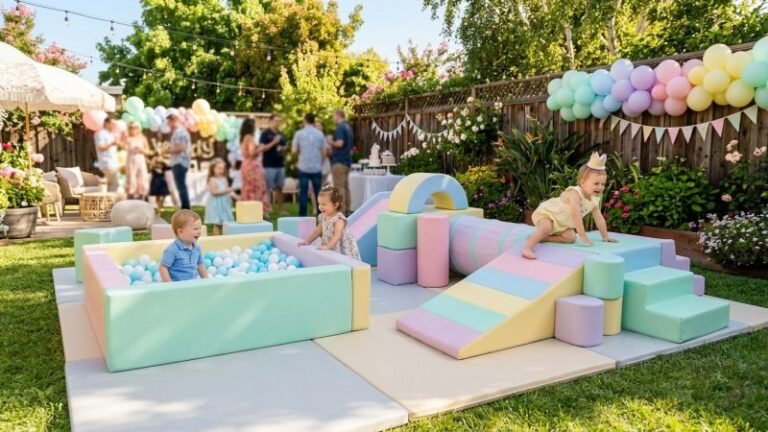
| Toddlers (Ages 1-4) | “Mommy & Me” Morning Classes | Parents look for socialization; consistent weekly attendance. |
| Homeschoolers | Discounted “PE Credit” Hours | Large groups; fulfills physical education requirements. |
| Remote Workers | “Work & Play” Passes | Parents work on Wi-Fi while staff supervise play. |
Offering a “Monthly Pass” specifically for weekday mornings is another powerful tactic. It guarantees revenue even if the family does not show up. By filling these dead hours via dynamic pricing, you cover your fixed daily costs (rent and electricity). This means your busy weekend revenue becomes pure profit.
Upselling Ancillary Services and Merchandise
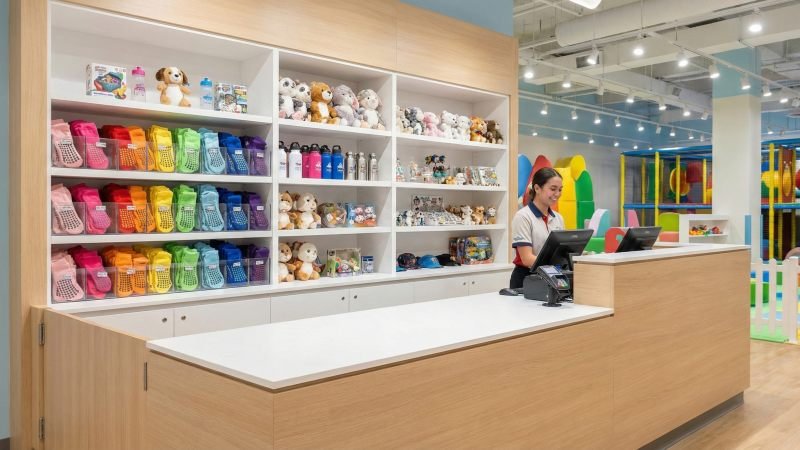
“Ancillary revenue” refers to the extra money customers spend after they have already paid to get in. In the movie theater business, the ticket pays the film studio, but the popcorn pays the theater owner. In the indoor playground business, merchandise and safety gear play a similar role.
Most insurance policies require every child to wear non-slip grip socks to prevent injuries on slides. This is not just a safety rule; it is a compliance-driven revenue stream. You should buy these socks in bulk for approximately $1.00 to $1.50 per pair and sell them for $3.00 to $5.00. This is a 200% to 300% markup.
Note: Sourcing costs for custom merchandise vary based on order volume and shipping rates. Always calculate the “landed cost” (including tariffs) before setting your retail price.
Now, look at your lobby layout. Place low-cost, colorful toys at child-eye level near the exit gate. This triggers the “impulse buy.” A child who just had a great time will often ask for a small souvenir.
High-Margin Upsell Examples
| Item | Estimated Cost | Retail Price | Profit Margin |
|---|---|---|---|
| Branded Grip Socks | $1.20 | $3.50 | ~190% |
| Helium Balloons | $0.50 | $3.00 | ~500% |
| Plush Toys | $3.00 | $10.00 | ~230% |
| Glow Sticks | $0.20 | $1.00 | ~400% |
These small transactions add up quickly. If you have 1,000 visitors a month and half of them buy socks and a balloon, you could add thousands of dollars to your net profit without needing to find a single new customer. This strategy maximizes the value of every person walking through your door.
Conclusion
Is opening an indoor playground the right financial move for you?
Investing in an indoor playground offers a robust path to profitability, provided you manage the “Big Two” expenses—rent and labor—while maximizing high-margin services like birthday parties. The difference between a struggling venue and a thriving one often lies in efficient space utilization and aggressive ancillary sales.
Hitting that 20% to 40% profit margin is standard, but achieving it requires a disciplined business plan. You must verify that your local market has enough demand to support your facility size and that your lease terms allow for sustainable growth.